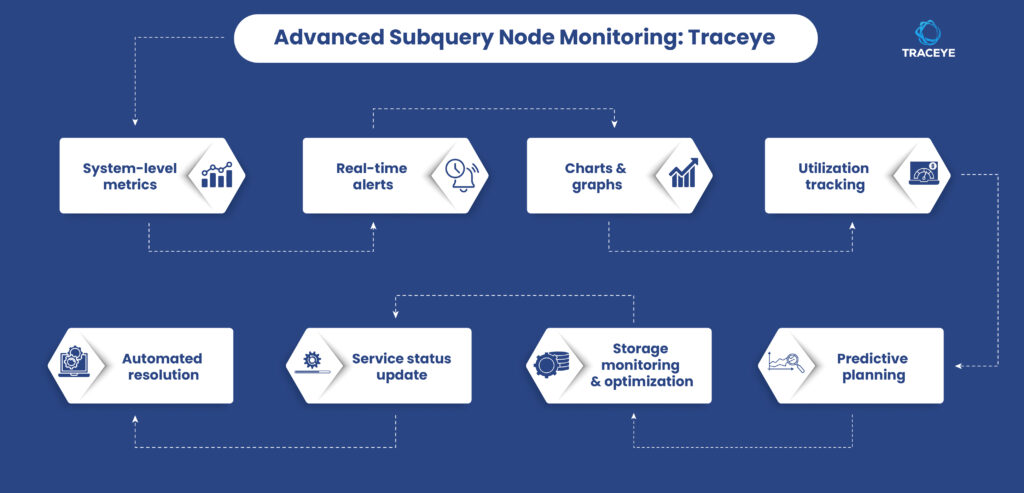
Traceye has added a major upgrade to its data indexing solution– advanced Subquery node monitoring. Earlier, Traceye has introduced same level of monitoring capabilities for dedicated Graph nodes.
As we already know, monitoring a node or network is critical to ensure performance and security, keeping the node up and running 24*7. Now, with Traceye’s innovative monitoring for dedicated nodes, your Subquery node will maintain its high performance without requiring any heavy lifting from on your end. The main reason behind introducing this update is to make each Subquery node self-sufficient and ensure robustness on each of their operations.
Overview of Traceye and its comprehensive features
Traceye is designed as an advanced, multi-function data indexing platform that allows diverse blockchains, be it Layer1/Layer2 blockchains, application-specific blockchains, and rollups, to get blazing-fast access to on-chain data. Traceye offers unique benefits like 5X better data backfilling, 50% lower data lag, zero maintenance, 99.99% node availability, automatic sync, and access to a range of value-added features. Let’s discuss them briefly:
- One-click deployment tool to cut down the hassle of manual programming, testing, or optimization.
- Value-added add-ons like webhooks for real-time data indexing, BI Analytics tool, Indexer & ledger data pruning, custom entities, etc.
- Quick node configuration to add multiple networks for which you want to index data.
- Dedicated infrastructure management with 24/7 node monitoring and management.
A bit about dedicated Subquery node on Traceye
As a full-fledged data indexing solution, Traceye has added support for a range of leading data indexing protocols, including the Subquery Network. Subquery offers fast and reliable access to blockchain data through its custom, decentralized data APIs.
Considering this high feasibility of Subquery’s indexing services, Traceye allows projects to launch and manage their dedicated Subquery node in a secure and seamless way. By dedicated, we mean a indexer node dedicated for single-use, which unlocks further benefits like extremely fast response time, rapid indexing, flexibility to launch use-case specific subgraphs on it, and more.
To maintain ease, Traceye offers low-code option to launch Subquery node. It offers a one-click platform from where you can subscribe for nodes, add desired customization, and instantly deploy your dedicated node. No need for coding, computation or cost-intensive process or need a technical team.
How Traceye offers advanced monitoring for dedicated Subquery nodes?
Traceye comes with a default feature of 24/7 monitoring and performance optimization feature for all its indexer node, though we are keeping our focus on Subquery for now.
Once you’ve successfully launched your Subquery node on Traceye with specific customizations and add-ons, monitoring will start instantly for the node. However, you can see the metrics and other monitoring-related details once the node’s status is live. Here’s how the whole thing works:
- Visit Traceye’s dashboard and navigate through the ‘Subquery Nodes’ located in the left-side panel. Note that you must launch a dedicated Subquery node first, i.e., complete the subscription and configuration step.
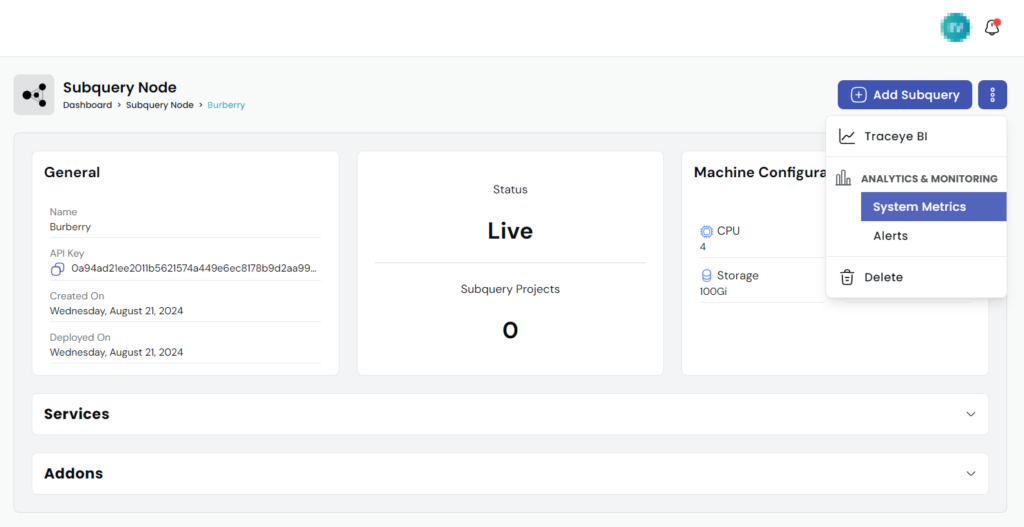
- If the status of your Subquery node is ‘Live’ (as seen in the previous image), click ‘View’. A new dashboard will now open; click on the three dots menu to see the ‘Analytics & Monitoring’ option.

As you can see, there are two options for analytics & monitoring– System Metrics and Alerts:
- System metrics refer to the critical parameters related to the performance, quality, and overall efficiency of your dedicated Subquery node. These metrics allow you to understand how well your node is performing, identify the improvement areas, and establish further benchmarks. In simple terms, system metrics are all about machine utilization, resources, and hardware-related information, representing the performance of your node.
- Alerts: Real-time, instant alerts feature is integrated into Traceye to keep you updated about any issues occurring in your live Subquery node. This is helpful to for the node operator and also for the Traceye team as they consistently identity the alerts and bypass the problem before it impacts the node performance.
- When you click on ‘System Metrics’ , a separate, detailed dashboard will appear with all the information and details explained through interactive graphs, pie charts, and tables. The first option here is Dashboard information; it will provide you Network ID and Node ID for your dedicated Subquery node.
- Now, let’s dive into Traceye’s Subquery node monitoring one by one. Starting with Disk Space Utilization. This metric refers to the total amount of storage and bandwidth being utilized by the node. In case the demand is rising for some reason, this metric will allow you to optimize the infrastructure on time. Also, there’s an auto update option. Once activated, it will update the disk space utilization details every 5 minutes or the duration you select, for example, 2-3 minutes.
- Next is CPU utilization by name space; analytics. Name spaces are listed on the right-side of the dashboard like cert-manager, graph, ingress-nginx, kube-flannel, kube-system. The exact percentage of disk space utilization will be provided, along with the names.
Another vital metric in Subquery node monitoring is Memory utilization by namespace, analytics, cert-manager….kube-system. Here again, the memory consumption for each name space will be provided in MiB (mebibyte) unit.
For both the memory and CPU utilization, you will get the auto-update feature that we discussed during the Disk Space Utilization.
7. Now, it’s time to discuss ‘Alerts’ feature. These alerts in Traceye are produced based on the real-time performance of Subquery node, assisting Traceye in quick remediation and proactive management.
As you can see, there are multiple alerts listed on the dashboard referring to the issue with their corresponding Alert ID, name, severity, alert type, status, component, and timestamp. These alerts are generated and the respective issue get instantly solved for superior performance of your Subquery node.

Launch & manage your Subquery node on Traceye
Subquery network’s data indexing services have already proved their high-feasibility for many projects. And, hence we can notice the sharp rise in its adoption. If you plan to launch a dedicated Subquery node, Traceye can be your go-to indexing solution. Launching a node is quick and really simple on Traceye– Try it yourself!
Also, if you have queries related to Traceye’s indexing services, please reach out to our experts. Send your concerns via mail or you can also schedule a call for a detailed discussion.

Product Director & an intrapreneur with a focus on intersection of technology and business models. Having 10+ years of experience in consulting, software design & architecture, product and project management. Career track follows working on ERPs, Consumer & Enterprise products, stints in AI & Machine Learning and finally settling in decentralization & Blockchain space.
